Planning for the use of tables, charts and graphs within each maths unit rather than having a separate unit on statistics can be more effective for learning, much easier to teach and helps children to make connections.
Despite a reduction in some strands of the maths curriculum, there is still a lot of maths content to cover in the new PoS. Integrating statistics into each unit is one way to give some space in the planning. This also fits in with the thinking behind the 2014 Curriculum to encourage teaching fewer things in greater depth (take a look at Tim Oates talking about the different approach to teaching from the new 2014 NC).
For example, a school I was in last term had 'The Weather' as a theme for some of the lessons in a unit. This was chosen because they had found a really good bar-line graph showing temperature range and negative numbers. It was a Y6 'Addition and Subtraction' unit so was perfect for it.
Related article:
Shape, problem-solving and data handling
Activities for KS1 and KS2
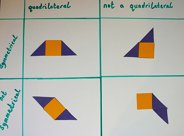
• a shape unit - venn, tree and Carroll diagrams are a useful focus
• a number unit - tables of information can be used to generate statistics and questions
• a subtraction unit - bar charts can pick out differences when interpreting the data.
Related article:
Handling data and modelling bar charts
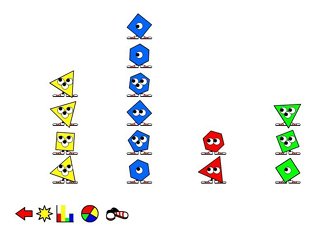
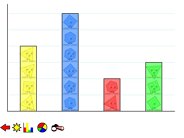
Using Furbles to relate data to a graph
So, how will you begin to plan for an integrated approach to statistics?
The aim is to make sure that the children get a rich and relevant range of data representation and that there are no gaps in their experiences.
You will need a list of the range of data representations for your class to use as a record sheet. This will help make sure you are covering the range of outcomes.
You could begin by highlighting (at least) one statement for each unit for the whole year, along with some of the assessments for this that can take place towards the end of the unit. However, be careful that this doesn't become rigid and limiting. It is easy to just teach to this list rather than looking at the most appropriate data format to use.
So, my suggestion is to review the statistics focus as you plan each unit, using the planning record sheet to make sure you are covering the range of outcomes identified on the sheet.
There is progression, but the progression in statistics is not linear or clear-cut (mathematics isn't as simple as that!), so there is no need for a specified order. They will be repeated using different items of data to make sure the children are confident in interpreting a good range of representations.
Teachers need to reflect on and review each unit, recording the data handling objectives covered and assessing the children's understanding so that they know which aspects of statistics to focus on in subsequent units.
For schools using my Maths Planning Menu there are 'Statistics Planning Record Sheets' for Y1/2, Y3/4 and Y5/6.
Use these alongside the 18 Unit Planning templates for each Year group.
Related articles:
New national curriculum for maths - using data handling to help make connections
Shape, problem-solving and data handling
Activities for KS1 and KS2
Teaching data handling creatively using graph stories
Open ended activities for Y5-6
Maths in a weather theme - which month has most rain?
Using data from the Met office.


