The process of gathering data and then representing it as a graph can be a difficult thing to model. Children are often able to interpret graphs, but not really have a feel for what the graph represents or how it was generated.
Physically arranging a selection of children, shapes or objects into columns according to chosen criteria is one way of doing it, and can help make sense of the process for children. I saw a good alternative in a lesson I observed yesterday, using a piece of software I haven’t seen for a few years.
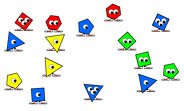
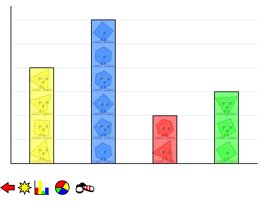
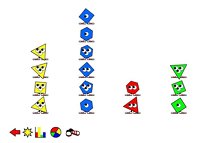
The teacher used Furbles, a program devised by Alec McEahran back in 2003 (www.ptolemy.co.uk/furbles03), to generate shapes with different numbers of eyes and colours. The strength of the program is the simple way the Furbles move from their random position to columns or as a pie chart to show them in graphical form.
The teacher used Furbles, a program devised by Alec McEahran back in 2003 (www.ptolemy.co.uk/furbles03), to generate shapes with different numbers of eyes and colours. The strength of the program is the simple way the Furbles move from their random position to columns or as a pie chart to show them in graphical form.


